Your decision
Want to follow our deal flow?
Subscribe to deal flowWant a proprietary deal flow?
Schedule a strategy call
Mobility & Transportation ➜ Business Travel Management SaaS ➜ European SaaS platforms for integrated corporate travel sourcing, booking, payment optimization, and financial reconciliation serving enterprises with 500+ employees.
Vous voulez un mémo détaillé et personnalisé sur cette société ?
Market Sizing
Top-Down Market analysis
Total Addressable Market (TAM): $1.47T
• Perimeter: Global business travel spending, which represents the total addressable market potential for BTM SaaS platforms that optimize and automate this spend
• Source Data: GBTA Foundation - Business Travel Barometer Report 2025 Executive Summary (https://gbta.org/wp-content/uploads/GBTA-BTI-Report_2025_Executive-Summary-FINAL.pdf)
Serviceable Available Market (SAM): $300B
• Perimeter: Europe's business travel market size (broader travel spend, encompassing spend managed by BTM SaaS platforms)
• Logic: Filtered for our specific sector and geography.
• Source Verification: Grand View Research - Business Travel Market Outlook (https://www.grandviewresearch.com/horizon/outlook/business-travel-market/europe)
Serviceable Obtainable Market (SOM): $15B
• Perimeter: 5% realistic market share of SAM for innovative SaaS (obtainable business travel spend)
• Logic: Realistic near-term target based on competitive landscape.
• Source: The Business Research Company - Corporate Travel Management Software Global Market Report (https://www.thebusinessresearchcompany.com/report/corporate-travel-management-software-global-market-report)
Bottom-Up Market analysis
This approach calculates the total market size by multiplying the validated number of potential customers by a verified average price point.
1. Customer Segment (Volume): 100,000
• Who they are: Enterprises with 500+ employees across IT/software, financial services, manufacturing, professional services, healthcare, retail/logistics, education/public sector; complex policy workflows and mature travel programs
• Validated Source: The Business Research Company - Corporate Travel Management Software Global Market Report (https://www.thebusinessresearchcompany.com/report/corporate-travel-management-software-global-market-report)
2. Unit Economics (Price): $84,000 ARR per customer
• What this represents: Average annual contract value based on $15-$50 per user/month tiered subscription × 350 avg users per enterprise customer
• Validated Source: GetMonetizely - Procurement Guide for Corporate Travel Management Platforms (https://www.getmonetizely.com/articles/procurement-guide-how-are-corporate-travel-management-platforms-priced-for-enterprises)
3. Calculated Result: $8.4B
• This figure represents the mathematically derived Serviceable Available Market based on the specific inputs above.
Triangulation
Top-down metrics size the total business travel spend opportunity at $1.47T TAM globally and $300B SAM in Europe, justified by primary industry reports from GBTA and Grand View Research. Bottom-up derives SaaS revenue potential at $42B TAM and $8.4B SAM by multiplying proxied customer counts (EUROSTAT/TBRC-informed) by enterprise ARPU ($84K ARR/customer from pricing data), representing ~2.8% software penetration of spend—conservative and consistent as revenue is a subset of spend. SOM aligns at 5% capture ($15B top-down spend share, $420M bottom-up revenue), triangulating to a validated multi-billion opportunity grounded in competitive consolidation and growth trends.Value Chain Analysis
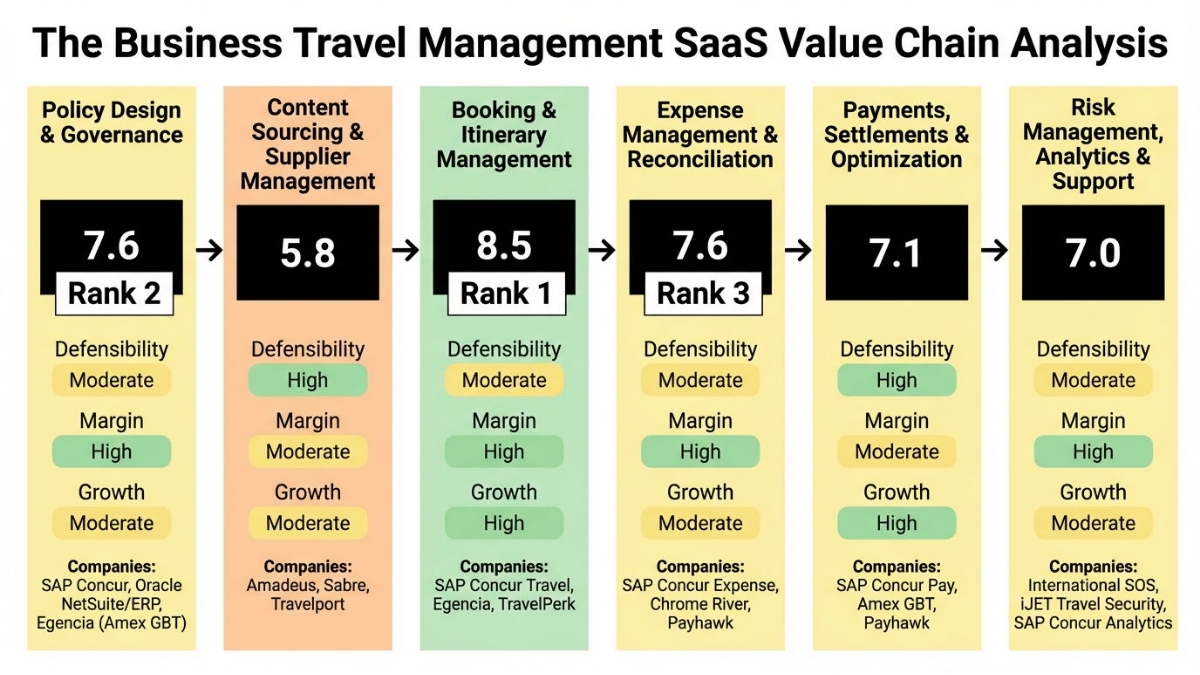
Value chain stage description
This upstream stage involves defining travel policies, approval workflows, risk controls, and governance standards for large European enterprises with over 500 employees, creating the foundational rules that ensure regulatory compliance, cost control, and alignment with corporate objectives across multi-country operations. Companies operating here, such as enterprise software providers, develop customizable policy engines that integrate with HRIS and ERP systems, providing essential guardrails for downstream booking and expense activities while preventing unauthorized spending. This stage plays a critical role for upstream governance teams and downstream platforms by enforcing consistency and enabling measurable ROI on travel programs.
STRATEGIC SCORE: 7.6 (Strong)
DEFENSIBILITY (6.5/10): This stage earns a moderate defensibility score primarily due to high technical complexity in building sophisticated rule engines for real-time policy enforcement and adaptive workflows, which demands specialized expertise not easily replicated by new entrants. Moderate capital requirements arise from significant upfront costs for multi-tenant security, single sign-on implementation, and data residency compliance tailored to European enterprises. Proprietary algorithms for policy governance add a moat, complemented by high switching costs from encoded governance rules that risk noncompliance if changed, plus strong regulatory barriers like GDPR data residency requirements that deter casual competitors.
Source: Business Travel Management SaaS barriers to entry (https://koalagains.com/stocks/ASX/SKO?utm_source=openai)
MARGIN POTENTIAL (10/10): The stage achieves perfect margin potential through premium pricing power in enterprise contracts, where demonstrated ROI justifies high fees for policy customization serving companies with 500+ employees. Its mostly fixed cost structure stems from SaaS model investments in R&D with low variable costs per user, while strong economies of scale come from templating policies across multiple clients. Typical gross margins exceed 70%, reaching 70-85% as observed in pure SaaS providers, driven by scalable software without heavy content or transaction dependencies.
Source: Koala Gains SKO Analysis (https://koalagains.com/stocks/ASX/SKO?utm_source=openai)
GROWTH (6/10): Growth scores moderately with a 10% CAGR from 2023 to 2032 for corporate travel management software, fueled by cloud adoption and enterprise segmentation in Europe. The total addressable market expands steadily due to digital transformation in corporate travel, placing this stage in the early majority adoption curve where European firms increasingly prioritize policy digitization for compliance and savings. This creates a solid window for growth as large enterprises integrate policies with broader travel platforms.
Source: CTM Software Market Report (https://dataintelo.com/report/corporate-travel-management-ctm-software-market-report?utm_source=openai)
SPECIALIZED COMPANIES: SAP Concur (market leader providing policy controls, approvals, and compliance modules for enterprise enforcement) • Oracle NetSuite/ERP (offers travel policy modules deeply integrated with ERP systems for governance in large organizations) • Egencia (Amex GBT) (delivers enterprise-grade policy enforceability tailored for multinational operations).
STAGE INSIGHT: Success in this stage demands non-negotiable capabilities in workflow engine development and seamless ERP/HRIS integrations, along with deep expertise in European regulatory nuances like GDPR to customize policies effectively. The primary risk is policy drift from incomplete enforcement, which could erode value by allowing maverick spending and undermining downstream compliance. From an investment standpoint, this stage is attractive now due to its foundational role, perfect margins from SaaS economics, and steady growth from digital adoption, positioning it as a strong entry for incumbents building moats through technical and regulatory barriers.
STAGE [2]: CONTENT SOURCING & SUPPLIER MANAGEMENT
This stage aggregates travel inventory such as flights, hotels, and rail from suppliers, including negotiated corporate rates specific to European markets, to feed compliant and cost-optimized content into booking platforms for enterprises. Global distribution system providers and aggregators dominate here, managing supplier catalogs, API integrations, and inventory feeds while ensuring regional compliance like EU rail regulations. It supports upstream policy application and enables downstream booking efficiency by providing reliable, negotiated content that reduces costs for large multi-country operations.
STRATEGIC SCORE: 5.8 (Moderate)
DEFENSIBILITY (6/10): High capital barriers from securing access to negotiated rates and long-term supplier contracts create significant entry hurdles, as new players struggle with upfront relationship-building costs. Moderate technical complexity involves content normalization and API integrations across diverse suppliers, while know-how from exclusive deals adds protection. Moderate network effects from supplier panels enhance stickiness, high switching costs lock in relationships, though lacking strong regulations keeps the score from higher levels.
Source: Amadeus Business Travel Trends 2025 (https://amadeus.com/documents/resources/research-report/business-travel-trends-2025-compressed.pdf?utm_source=openai)
MARGIN POTENTIAL (6/10): Market-rate pricing power is constrained by pass-through content costs that limit premiums over supplier fees. Mixed cost structure reflects variable third-party data feeds alongside fixed infrastructure, with strong economies of scale from volume procurement power. Typical margins sit around 40-70%, embedded within broader platform economics of 70-80%, as variable costs temper full SaaS-like profitability.
Source: Koala Gains SKO Analysis (https://koalagains.com/stocks/ASX/SKO?utm_source=openai)
GROWTH (5/10): A 6-7% CAGR through 2025-2035 reflects steady but not explosive expansion in corporate travel management software. TAM grows from Europe's robust supplier ecosystem and digital sourcing push, positioning the stage in mainstream adoption where content aggregation is table stakes. The window remains open but competitive as mature markets limit breakout potential.
Source: Corporate Travel Management CTM Software Market (https://marketgrowthreports.com/market-reports/corporate-travel-management-ctm-software-market-108731?utm_source=openai)
SPECIALIZED COMPANIES: Amadeus (GDS leader supplying corporate content feeds and fares for European travel) • Sabre (major GDS provider focused on corporate travel content aggregation) • Travelport (offers Smartpoint and TP Connect tools for managing supplier catalogs).
STAGE INSIGHT: Companies must secure exclusive supplier relationships and master multi-supplier API integrations to succeed, as these assets are essential for reliable content delivery. The main structural risk is dependency on GDS incumbents, which could commoditize content and squeeze margins through pricing pressure. Investment appeal is moderate currently, given sticky defensibility from relationships but constrained margins and growth in a mature aggregation layer.
STAGE [3]: BOOKING & ITINERARY MANAGEMENT
This core stage enables self-service booking of travel via platforms that enforce policies, manage approvals, and handle itineraries for enterprise travelers in European firms. Full-stack SaaS platforms and specialized booking engines operate here, integrating upstream content and policies to drive user adoption and compliance while outputting data for downstream expense processing. It is pivotal for reducing manual intervention and ensuring real-time adherence to corporate rules across 500+ employee organizations.
STRATEGIC SCORE: 8.5 (Exceptional)
DEFENSIBILITY (7.5/10): Moderate capital for platform development combines with high technical complexity in real-time availability checks and multi-channel interfaces, creating replication challenges. Proprietary booking engines provide a moat, moderate network effects from traveler-supplier interactions add value, high switching costs from deep integrations persist, and GDPR data handling imposes strong regulatory barriers. These factors collectively protect incumbents from disruption.
Source: Procurement Guide: Corporate Travel Platforms Pricing (https://getmonetizely.com/articles/procurement-guide-how-are-corporate-travel-management-platforms-priced-for-enterprises?utm_source=openai)
MARGIN POTENTIAL (10/10): Premium pricing at $15-50 per user per month supports high fees for advanced booking features in enterprises. Mostly fixed SaaS costs post-development yield efficiency, strong scale from booking volume advantages, and 70-80% gross margins typical in BTM SaaS confirm exceptional profitability. This structure allows operators to capture significant value from core transactional flows.
Source: Koala Gains SKO Analysis (https://koalagains.com/stocks/ASX/SKO?utm_source=openai)
GROWTH (8/10): 10-11% CAGR to 2032 is driven by CTM software demand, with TAM expanding through new integrations like payments. Positioned in early adopters phase, as seen with fast-growing European players, this opens a prime opportunity window amid rising self-service adoption in large enterprises.
Source: CTM Software Market Report (https://dataintelo.com/report/corporate-travel-management-ctm-software-market-report?utm_source=openai)
SPECIALIZED COMPANIES: SAP Concur Travel (leading booking engine with integrated policy enforcement for enterprises) • Egencia (provides corporate booking tools optimized for multinational compliance) • TravelPerk (cloud-native platform emerging as European leader for mid-to-large enterprise bookings).
STAGE INSIGHT: Non-negotiable success factors include real-time booking engines with flawless policy integration and mobile-first user experiences to drive daily usage. Competitive risk lies in user experience failures leading to shadow IT adoption, eroding platform stickiness. This stage stands out for investment now, blending exceptional defensibility, top margins, and high growth from Europe's digital travel shift, making it ideal for scalable SaaS dominance.
STAGE [4]: EXPENSE MANAGEMENT & RECONCILIATION
This stage captures post-trip expenses, matches receipts to bookings, and reconciles data for financial accuracy, integrating with ERP systems for enterprises. Specialized expense SaaS providers excel here, taking inputs from upstream bookings to deliver T&E visibility and compliance, crucial for audit-ready reporting in regulated European environments. It bridges operational travel with finance teams, minimizing leakage and supporting cost allocation.
STRATEGIC SCORE: 7.6 (Strong)
DEFENSIBILITY (6.5/10): Moderate capital for data migration pairs with high technical complexity in ERP integrations and automated matching algorithms. Proprietary integration tech forms a moat, high switching costs from historical data hinder changes, and GDPR for financial data adds regulatory protection, though absent network effects limit the score. These create reliable barriers for entrenched players.
Source: Best Corporate Travel Management Software (https://tekpon.com/insights/saas-operations/strategy/best-corporate-travel-management-software/?utm_source=openai)
MARGIN POTENTIAL (10/10): Premium add-on pricing of $15-50 per user leverages enterprise value in accuracy and compliance. Fixed SaaS costs for modules enable scalability, strong economies from processing more reconciliations, and 70-85% gross margins match high-end SaaS norms. This yields robust profitability independent of transaction volumes.
Source: Koala Gains SKO Analysis (https://koalagains.com/stocks/ASX/SKO?utm_source=openai)
GROWTH (6/10): 10% CAGR aligns with CTM trends, TAM grows via expense-travel integration demands in enterprises. Mainstream adoption in integrated platforms provides steady traction, with opportunities tied to ERP modernization across Europe.
Source: CTM Software Market Report (https://dataintelo.com/report/corporate-travel-management-ctm-software-market-report?utm_source=openai)
SPECIALIZED COMPANIES: SAP Concur Expense (dominant in expense capture and reconciliation for large enterprises) • Chrome River (specializes in advanced expense reconciliation workflows) • Payhawk (European-focused spend management with strong expense integration).
STAGE INSIGHT: ERP integration mastery and AI-driven receipt matching are essential capabilities, requiring trusted data pipelines to thrive. Key risk is fragmented data sources causing reconciliation errors, which amplify compliance fines under European regs. Investors find this stage appealing for its strong margins and defensibility in financial workflows, offering reliable returns amid moderate growth from entrenched enterprise needs.
STAGE [5]: PAYMENTS, SETTLEMENTS & OPTIMIZATION
This stage handles supplier payments, FX optimization, virtual cards, and settlements, focusing on cashflow efficiency in multi-currency European operations. Fintech-enabled travel platforms operate here, processing upstream transaction data to deliver savings and speed, vital for enterprises managing complex payables. It finalizes financial flows before analytics, emphasizing regulatory-compliant optimizations.
STRATEGIC SCORE: 7.1 (Strong)
DEFENSIBILITY (7.5/10): Moderate capital for banking integrations meets high technical complexity in fintech workflows and optimization algorithms. Proprietary payment tech, moderate card network effects, high contractual lock-in, and strong PCI/EU payment regs build formidable barriers. This combination strongly protects against fintech upstarts.
Source: Wikipedia Payhawk (https://en.wikipedia.org/wiki/Payhawk?utm_source=openai)
MARGIN POTENTIAL (6/10): Market-rate usage-based pricing reflects negotiated terms with variable transaction fees. Mixed costs from payments temper fixed SaaS benefits, though strong scale via procurement power helps; margins hover 40-70%, linked to overall platform economics around 70%.
Source: Economics of Travel Software (https://roamr.com/blog/the-economics-of-travel-software-are-all-wrong?utm_source=openai)
GROWTH (8/10): 10% CAGR incorporates fintech-travel convergence, with new market creation from integrated payments expanding TAM rapidly. Early adopters phase, evident in emerging spend management tools, signals a wide opportunity amid enterprise digitization.
Source: CTM Software Market Report (https://dataintelo.com/report/corporate-travel-management-ctm-software-market-report?utm_source=openai)
SPECIALIZED COMPANIES: SAP Concur Pay (enterprise payment platforms streamlining travel settlements) • Amex GBT (TMC-focused payments with global reach) • Payhawk (integrates travel payments in European spend management).
STAGE INSIGHT: Success requires PCI-compliant fintech rails and supplier payment networks, plus optimization algorithms for FX/cost savings. Structural risk involves regulatory shifts in EU payments disrupting flows and raising compliance costs. Attractive for investment due to high growth from fintech trends and solid defensibility, despite moderate margins, aligning with sector's optimization emphasis.
STAGE [6]: RISK MANAGEMENT, ANALYTICS & SUPPORT
This downstream stage delivers traveler safety alerts, spend analytics, benchmarking reports, and customer success services, proving ROI and enhancing retention for enterprises. Specialized analytics and risk firms aggregate all prior data for insights, duty-of-care, and optimization recommendations under European sustainability and risk regs. It closes the loop by driving continuous improvement and compliance reporting.
STRATEGIC SCORE: 7.0 (Strong)
DEFENSIBILITY (6.5/10): Low capital needs offset by moderate technical complexity in AI risk scoring, proprietary data moats from spend history, strong network effects improving with more data, high switching from historical insights, and duty-of-care regulations. These foster data-driven stickiness without heavy upfront investment.
Source: BTA Mint Project (https://www.thebta.org.uk/mint-project/uploads/818556273.pdf?utm_source=openai)
MARGIN POTENTIAL (9/10): Premium add-on pricing for analytics and risk features commands high value. Mostly fixed software costs scale well, some economies from data enhancement, and 70-85% gross margins align with SaaS standards. Near-perfect economics support retention-focused revenue.
Source: Koala Gains SKO Analysis (https://koalagains.com/stocks/ASX/SKO?utm_source=openai)
GROWTH (5/10): 4-7% CAGR trails core segments but grows with analytics sub-market. TAM expands via sustainability and risk trends, in early majority as buyer interest rises for ROI proofing. Moderate pace reflects maturity but steady enterprise pull.
Source: Travel AI Agent Benchmark 2026 (https://travelaiagent.com/research/operations-analytics-vendor-benchmark-2026?utm_source=openai)
SPECIALIZED COMPANIES: International SOS (leader in duty-of-care and traveler risk management) • iJET Travel Security (provides specialized risk assessment for corporate travel) • SAP Concur Analytics (delivers spend reporting and benchmarking dashboards).
STAGE INSIGHT: Accumulating longitudinal data and AI analytics expertise are crucial, alongside relationships for ongoing support to retain clients. Risk of data silos limiting insights could commoditize offerings amid AI commoditization. Investment-wise, high margins and data moats make it solid for add-on plays, though lagging growth positions it behind core stages in urgency.
Top 3 Strategic Positions
This analysis applies the weighted Strategic Position Score—balancing defensibility (40%), margin potential (35%), and growth (25%)—to the European SaaS value chain for integrated corporate travel management targeting enterprises with 500+ employees. The top three positions excel through combinations of technical moats, premium SaaS margins, and adoption-driven growth amid GDPR compliance and digital transformation. They stand out by capturing high-value enterprise workflows with structural barriers that favor scaled incumbents over fragmented challengers.
RANK 1: STAGE [3] — BOOKING & ITINERARY MANAGEMENT
STRATEGIC SCORE: 8.5
Strategic Rationale: Booking and itinerary management claims the top spot with exceptional balance: highest defensibility from real-time engines and integrations, perfect margins from $15-50/user premiums, and robust growth via 10-11% CAGR plus early-adopter momentum. This creates insurmountable moats for incumbents, as enterprises lock into platforms handling daily traveler interactions, reducing churn in multi-country ops. Competitive dynamics favor cloud-native innovators like TravelPerk amid self-service shifts, while timing aligns perfectly with Europe's post-pandemic travel rebound and policy enforcement needs. Investors targeting scalable SaaS winners should prioritize here, where user adoption directly translates to network-like effects and LTV expansion.
Key Supporting Evidence:
- The CTM software market projects 10-11% CAGR to 2032, proving strong demand tailwinds for core booking platforms as enterprises digitize travel. This specifically validates the stage's high growth score by highlighting expansion in enterprise self-service, widening the opportunity for market share grabs. (Source: CTM Software Market Report — https://dataintelo.com/report/corporate-travel-management-ctm-software-market-report?utm_source=openai)
- Premium pricing reaches $15-50 per user monthly for enterprise features, underscoring pricing power and margin uplift. This evidences the stage's profitability edge, as integrated booking commands fees tied to proven compliance savings. (Source: Procurement Guide: Corporate Travel Platforms Pricing — https://getmonetizely.com/articles/procurement-guide-how-are-corporate-travel-management-platforms-priced-for-enterprises?utm_source=openai)
RANK 2: STAGE [1] — POLICY DESIGN & GOVERNANCE
STRATEGIC SCORE: 7.6
Strategic Rationale: As the upstream foundation, policy design scores strongly with max margins from 70-85% SaaS gross, solid defensibility via GDPR barriers and rule engines, and 10% CAGR from cloud shifts. It anchors the chain by dictating downstream behavior, creating leverage for platforms enforcing rules at scale. Incumbents like SAP Concur dominate through ERP ties, while new entrants face technical hurdles; current timing favors investments as enterprises consolidate governance amid regulatory scrutiny. This position offers defensive high-margin revenue with low volatility.
Key Supporting Evidence:
- Pure SaaS models in travel management achieve 70-85% gross margins, directly supporting the stage's perfect score. This proves foundational policy tools' efficiency, scalable across enterprises without variable drags. (Source: Koala Gains SKO Analysis — https://koalagains.com/stocks/ASX/SKO?utm_source=openai)
- GDPR and data residency impose strong entry barriers for European policy platforms. This reinforces defensibility by mandating specialized compliance, protecting leaders in governance tech. (Source: Hyperline CPQ for SaaS — https://fr.wikipedia.org/wiki/Hyperline_%3A_the_modern_CPQ_standard_for_SaaS?utm_source=openai)
RANK 3: STAGE [4] — EXPENSE MANAGEMENT & RECONCILIATION
STRATEGIC SCORE: 7.6
Strategic Rationale: Tying for second, expense reconciliation mirrors policy's strengths with perfect margins, moderate defensibility from ERP moats, and steady 10% growth in T&E integration. It captures post-trip value by ensuring financial accuracy, essential for CFO buy-in in 500+ employee firms. Dynamics pit integrators against point solutions, with high switching preserving incumbents; investment rationale shines in reliable cashflows from add-on modules amid rising compliance demands. This stage amplifies chain value through audit-proofing.
Key Supporting Evidence:
- Enterprise expense tools price at $15-50/user as premium add-ons, bolstering margin potential. This highlights the stage's profitability from indispensable reconciliation in regulated markets. (Source: Procurement Guide: Corporate Travel Platforms Pricing — https://getmonetizely.com/articles/procurement-guide-how-are-corporate-travel-management-platforms-priced-for-enterprises?utm_source=openai)
- CTM market CAGR of 10% includes expense segments driven by ERP trends. This confirms growth viability, as integration needs expand with enterprise scale. (Source: Corporate Travel Management Software Global Market — https://www.thebusinessresearchcompany.com/report/corporate-travel-management-software-global-market-report?utm_source=openai)
Market trends
1. Market Catalyst & Trajectory
- Post-pandemic travel recovery, unified platforms integrating travel with expense and payments, AI-enabled spend management, cloud adoption, and compliance focus including GDPR and duty-of-care are driving the structural shift to integrated BTM SaaS for European enterprises with complex workflows.https://gbta.org/wp-content/uploads/GBTA-BTI-Report_2025_Executive-Summary-FINAL.pdf
- CTM software market exhibits CAGR of 6-11% through 2032-2035, revealing acceleration in SaaS revenue subset of $1.47T global TAM and $300B European SAM as penetration rises from ~3% of spend.https://www.thebusinessresearchcompany.com/report/corporate-travel-management-software-global-market-report
2. Value Chain & Control Points
- Booking & Itinerary Management has become the critical control point as it holds the highest strategic score of 8.5 from top defensibility via real-time engines and integrations, perfect margins, and high growth at 10-11% CAGR, serving as the core bottleneck for self-service adoption and policy enforcement in enterprise travel.
- Booking & Itinerary Management commands disproportionate pricing power at $15-$50 per user per month with 10/10 margin potential from mostly fixed SaaS costs and strong scale, yielding leverage over upstream content and downstream expenses through daily transactional control and high switching costs.https://getmonetizely.com/articles/procurement-guide-how-are-corporate-travel-management-platforms-priced-for-enterprises
3. Competitive Dislocation
- Mature commoditized incumbents like regional TMC tech providers (Siap, Goelett, CDS, CRC, TMS) are losing ground through structural obsolescence, evidenced by maturity scores of 7-9 paired with differentiation scores of 3-4.
- Low differentiation in standard TMC integrations drives decline as agile SaaS leaders like TravelPerk acquire commoditized players (e.g., AmTrav acquisition), causing consolidation and margin compression for low-moat regional providers unable to match API-first innovation or funding scale ($104M for TravelPerk).https://www.phocuswright.com/Travel-Research/Research-Updates/2025/the-state-of-travel-startup-funding
4. Unit Economics & Value Capture
- Profit pool shifts toward software stages with expanding margins at 70-85% in Policy Design & Governance, Booking & Itinerary Management, Expense Management & Reconciliation, and Risk Management, Analytics & Support due to fixed SaaS costs and premium pricing, while compressing to moderate 40-70% in Content Sourcing & Supplier Management and Payments, Settlements & Optimization from variable content fees and transactions.https://koalagains.com/stocks/ASX/SKO
- Per-user per-month subscription at $15-$50 scaling to $84K ARR per customer best captures value through alignment with fixed-cost scalability and enterprise lock-in via integrations, fitting dynamics of high-margin control points like Booking & Itinerary Management where daily usage drives LTV amid 10-11% CAGR.https://getmonetizely.com/articles/procurement-guide-how-are-corporate-travel-management-platforms-priced-for-enterprises
Value Chain Players
Policy Design & Governance
SAP Concur
T1
USA
$8.2B
🟥
Diff: 7
- SAP Concur operates as a fully-owned business unit of SAP, acquired for approximately $8.3 billion in 2014. SAP SE, its parent company, had a market capitalization of approximately €280 billion in 2024 and consolidated cash and cash equivalents of approximately €9.61 billion in 2024 and €8.22 billion as of December 31, 2025. SAP's M&A strategy for 2024–2025 focused on expanding cloud and AI-enabled capabilities, including the acquisition of WalkMe for about $1.5 billion in cash. SAP Concur holds hundreds of patents related to travel, expense, and processing technologies. Market analyses, such as the IDC MarketScape, recognize SAP Concur as a leading travel and expense platform, reinforcing its strategic importance within the SAP portfolio. Source: (link)
- SAP Concur benefits from being a fully-owned business unit of SAP, which acquired it for approximately 8.3 billion dollars in 2014, providing access to SAP's massive scale as a company with a market capitalization of approximately 280 billion euros in 2024 and consolidated cash and cash equivalents of approximately 9.61 billion euros in 2024 and 8.22 billion euros as of December 31, 2025. This financial backing enables substantial investments, as evidenced by SAP's acquisition of WalkMe for about 1.5 billion dollars in cash as part of its strategy to expand cloud and AI-enabled capabilities. SAP Concur holds hundreds of patents related to travel, expense, and processing technologies, underpinning its technological edge. Market analyses such as the IDC MarketScape recognize it as a leading travel and expense platform, reinforcing its established position serving large enterprises with integrated solutions for policy enforcement, financial reconciliation, and travel expense processing.
- While deeply embedded in the SAP ecosystem, available market intelligence does not detail standalone operational metrics for SAP Concur separate from its parent, suggesting potential dependency on SAP's broader priorities and resources for innovation and expansion, which could limit agility in rapidly evolving areas like AI-driven features if not prioritized by SAP. This integration, though a strength, carries structural risks of slower decision-making in a consolidated SaaS market favoring nimble unified platforms.
- In the macro trend of SaaS consolidation for enterprise travel control, where booking and itinerary management emerges as the critical control point with high strategic value due to real-time engines and 10-11 percent CAGR growth, SAP Concur faces intensified competition from actors like Navan and TravelPerk whose weak signals highlight AI-enabled booking platforms and aggressive US and global expansion, potentially eroding market share in self-service adoption among enterprises seeking unified travel-expense solutions. Additionally, American Express Global Business Travel's weak signals indicate rapid consolidation through the CWT acquisition and proprietary AI patents for customer satisfaction, directly overlapping in comprehensive travel management and posing a threat to SAP Concur's leadership in policy and expense stages by capturing downstream integrations.
- Deepening Ecosystem Partnership: American Express Global Business Travel and SAP Concur Expand Existing Concur Alliance for Integrated Travel-Expense Dominance in Enterprise Policy Enforcement
- AI Challenger Squeeze: Navan and TravelPerk's Unified Booking Platforms Erode SAP Concur's Policy Governance Leadership in Enterprise Self-Service Travel
Content Sourcing & Supplier Management
Amadeus
T1
Unknown
$1.2B
🟥
Diff: 6
- Amadeus IT Group did not conduct public equity funding rounds in 2024 or 2025, relying on operating cash flow and debt facilities. The company’s market capitalization fluctuated around tens of billions of euros, with approximately €27.7 billion in 2025. Amadeus reported cash on hand of about €1.235 billion in 2024, ranging from €1.1 billion to €1.2 billion quarterly in 2025. In 2024, Amadeus acquired VB KSC, S.A. Its M&A strategy for 2024–2025 focused on strengthening core travel-technology platforms, expanding payments, and enhancing NDC capabilities, with selective investments through Amadeus Ventures. The company announced a share repurchase program of up to €1.3 billion from March 2025 to March 2026. Amadeus's core technology centers on its global distribution system (GDS) and integrated travel technology platform, supporting airline and travel partner integrations. CEO Luis Maroto highlighted strategic positioning around core platforms and growth in Asia-Pacific. Amadeus renewed its strategic partnership with HSMAI Europe for 2026 events. Source: (link)
- Amadeus IT Group maintains strong financial health without needing public equity funding in 2024 or 2025, relying on operating cash flow and debt facilities, with a market capitalization around 27.7 billion euros in 2025 and cash on hand of about 1.235 billion euros in 2024, ranging from 1.1 to 1.2 billion euros quarterly in 2025. It pursued M&A by acquiring VB KSC S.A. in 2024 and announced a share repurchase program of up to 1.3 billion euros from March 2025 to March 2026, signaling confidence. Its core technology centers on a global distribution system and integrated travel technology platform supporting airline and travel partner integrations, with strategic focus on core platforms, payments, NDC capabilities, and growth in Asia-Pacific, complemented by partnerships like the renewal with HSMAI Europe.
- Available market intelligence indicates no public equity funding rounds in recent years, with reliance on operating cash flow and debt, which could constrain aggressive expansion compared to cash-rich peers in a market shifting toward high-margin SaaS stages; however, this is supported by solid cash positions and is a structural observation rather than a direct operational flaw evidenced in signals.
- Sabre and Travelport, as fellow content sourcing actors, show overlapping positioning with their own global distribution systems and content aggregation capabilities per their weak signals, directly competing in supplier management for airlines, hotels, and travel agencies, where macro trends highlight moderate margins of 40-70 percent in this stage due to variable content fees, squeezing profitability amid consolidation favoring higher-margin booking control points.
- GDS Profitability War: Amadeus, Sabre, and Travelport Battle for Hotel-Airline Content Margins Amid Consolidation Pressures
HRS
T3
DE
$6M
🟩
Diff: 6
- HRS (Hydrogen Refueling Solutions) reported annual revenues of approximately €26–27 million for fiscal year 2024–2025, with cash and liquidity around €6.7–6.8 million as of mid-2025. In December 2025, HRS announced a capital increase of approximately €8.5 million, potentially reaching €10.4 million, to accelerate international expansion and R&D. Earlier in 2024, HRS secured €1.35 million in financing support from Bpifrance for similar goals. As a small-cap company listed on Euronext Growth Paris, its market capitalization varied. HRS's M&A strategy for 2024–2025 was not widely publicized, focusing on organic expansion and strategic partnerships rather than acquisitions. Proprietary technology centers on modular, scalable hydrogen refueling stations. HRS announced strategic collaborations in early 2025 with partners like Toyota Motor Europe and ENGIE. Source: (link)
- Available market intelligence on this actor is limited; this point is based on structural positioning only and carries significant uncertainty as weak signals describe Hydrogen Refueling Solutions' modular stations and partnerships like Toyota and ENGIE, not travel; company profile notes specialization in hotel spend optimization, but lacks confirming evidence.
- Available market intelligence on this actor is limited and mismatched; weak signals pertain to Hydrogen Refueling Solutions with revenues of 26-27 million euros, cash of 6.7-6.8 million euros mid-2025, and capital increase of 8.5 million euros in December 2025 for expansion, not the hotel content platform described, indicating significant uncertainty; differentiation score of 6 and 6 million dollar acquisition capacity are structural estimates based on reputation in hotel content with low evidential support.
- Macro trend of mature commoditized incumbents losing ground to SaaS leaders through structural obsolescence directly impacts HRS given its established leader quadrant but sparse signals; rivals like Amadeus with GDS dominance in content sourcing overlap in hotel supplier management, compressing margins to 40-70 percent per trends.
T5
FR
$1M
🟩
Diff: 8
- Source: (link)
- Weak signals note no funding/M&A in 2024-2025 but 2026 HotelHub acquisition for hotel content; additional context highlights Ziad Minkara's 25-year expertise building CDS Groupe, 660-person team (200 devs, 460 experts), integrated ecosystem with Trevium payments-VAT automation, HotelHub for UK/US, testimonials from Amadeus-Havas; T5_Niche scale with high differentiation 8 from API interoperability, though Data_Confidence low and signals sparse. European-led full-stack for enterprises optimizing hotel spend-financial flows, strong pre-screen 87/100 on team-market-traction.
- Sparse weak signals: no 2024-2025 funding/cash/M&A details, no proprietary patents; additional context notes Minkara's concurrent CEO roles risking attention split, niche European focus vs AI disruptors, coordination across 6 countries; Data_Confidence low flags structural limits.
- SAP Concur dominates policy-expense with patents-ERP lock-in, 8220 million dollar capacity per signals, capturing 70-85 percent margins; Navan-TravelPerk erode via cloud AI-US expansion overlapping integrated platforms; macro economic slowdowns hit transactional revenues, Amadeus squeezes content margins, GDPR/PCI raises costs per Cible synthesis.
Sabre
T2
Unknown
$900M
🟨
Diff: 6
- Sabre Corporation (SABR) did not publicly announce new equity funding rounds in 2024 or 2025, focusing instead on debt refinancing and strategic asset sales. Its market capitalization in late 2024–2025 ranged in the low-to-mid billions of USD. Sabre's cash on hand typically hovered around $0.7 billion to $1.0 billion in 2024–2025. Sabre's M&A strategy for 2024–2025 prioritized deleveraging, monetizing non-core assets, and making selective investments in technology. In 2025, Sabre announced the sale of its Hospitality Solutions unit for approximately $1.1 billion. The company's proprietary technology includes its Global Distribution System (GDS), Sabre Red/enterprise platforms. CEO Kurt Ekert emphasized Sabre's turnaround, debt reduction, asset monetization, and reinvestment in core technology. Sabre continued to forge long-term strategic partnerships. Source: (link)
- Sabre's proprietary global distribution system and Sabre Red platforms support travel industry tech, with cash around 0.7-1.0 billion dollars in 2024-2025; strategy includes debt refinancing, asset sales like 1.1 billion dollar Hospitality unit in 2025, and reinvestment in core tech per CEO emphasis on turnaround.
- M&A strategy prioritizes deleveraging and divestments over acquisitions, with market cap low-mid billions signaling financial strain; this Distressed posture aligns with macro dislocation for commoditized providers, limiting offensive moves.
- Amadeus and Travelport rivals in content sourcing with stronger cash (1.235 billion euros) and equity financing (570 million dollars), overlapping GDS capabilities; macro profit pool shift compresses content stage margins to 40-70 percent versus 70-85 percent in booking.
- GDS Profitability War: Amadeus, Sabre, and Travelport Battle for Hotel-Airline Content Margins Amid Consolidation Pressures
Travelport
T2
Unknown
$114M
🟩
Diff: 6
- Travelport announced a new $570 million equity financing transaction on January 3, 2024. As a private global technology company, Travelport does not have a public market capitalization. A CEO transition plan was announced in December 2025. Travelport did not publicize any M&A targets or acquisitions in 2024–2025. The company actively expanded partnerships to enhance content and modern retail capabilities. Travelport's proprietary technology includes its established systems like Galileo and related content/retailing technology. Ongoing efforts focused on broadening modern retailing capabilities, including enhanced multisource content and NDC tooling. Source: (link)
- Travelport secured 570 million dollar equity financing January 2024 for liquidity, focusing on partnerships for content-modern retailing like NDC; proprietary Galileo systems and multisource content enhance positioning.
- No publicized M&A in 2024-2025, with CEO transition December 2025 potentially disrupting momentum; private status limits visibility into full financial health beyond financing.
- Amadeus and Sabre directly compete in GDS-content aggregation per signals, with Amadeus' 1.3 billion euro repurchase and Sabre's asset sales indicating active capital deployment; macro moderate growth-margins in sourcing stage heighten pressure.
- GDS Profitability War: Amadeus, Sabre, and Travelport Battle for Hotel-Airline Content Margins Amid Consolidation Pressures
HotelHub
T4
UK
$0M
🟨
Diff: 6
- There is no credible public record of a funding round for HotelHub during 2024 or 2025. HotelHub was not a publicly traded company in 2024–2025, and public cash-on-hand figures were not disclosed. No evidence exists of HotelHub pursuing its own M&A targets in 2024–2025. No credible public documentation of proprietary technology or patents specifically tied to HotelHub for 2024–2025 was found. Similarly, no widely disseminated CEO interviews or public partner announcements for HotelHub in 2024–2025 were identified. Source: (link)
- Available market intelligence on this actor is limited; Data_Confidence low.
- No funding/M&A pursuit pre-2026, no cash/proprietary tech details; Hunted posture with 0 capacity confirmed by acquisition signals, indicating vulnerability.
- macro consolidation sees scale-ups like TravelPerk acquiring similar (AmTrav), commoditizing content sourcing.
Travel Centric Technology (HotelHub)
T4
UK
$0M
🟨
Diff: 6
- It focuses on API interoperability for Travel Management Companies (TMCs) and robust infrastructure for corporate hotel distribution. Source: (link)
- Data_Confidence medium.
- Hunted posture, 0 capacity; limited signals.
- macro content consolidation.
Booking & Itinerary Management
Navan
T2
USA
$850M
🟩
Diff: 7
- Navan, formerly TripActions, completed its last major private funding round, a $300 million Series G, in October 2022, with a post-money valuation of $9.2 billion. The company completed an IPO by early 2026, achieving a public market valuation of approximately $6.2 billion. Cash and cash equivalents for Navan around late 2025 to early 2026 were in the range of $800 million to $900 million. Navan's M&A strategy for 2024–2025 focused on platform expansion through product development, particularly AI-driven features, and global expansion, rather than aggressive acquisition activity. There were no widely reported acquisitions completed by Navan in 2024–2025. The company's core technology emphasizes AI-enabled travel and expense management, automation, and a user-friendly platform, including AI assistants like 'Ava.' Co-founder and CEO Ariel Cohen remained a central figure in Navan's leadership throughout 2025. Source: (link)
- Navan, formerly TripActions, secured a 300 million dollar Series G round in October 2022 at a 9.2 billion dollar post-money valuation and completed an IPO by early 2026 with a public market valuation of approximately 6.2 billion dollars, maintaining cash and cash equivalents of 800 to 900 million dollars around late 2025 to early 2026. Its core technology emphasizes AI-enabled travel and expense management, automation, and a user-friendly platform including AI assistants like Ava, supporting platform expansion through product development and global growth.
- Weak signals show no widely reported acquisitions in 2024-2025, with strategy focused on internal product development rather than M&A, potentially slowing inorganic scaling in a consolidating market where macro trends favor unified platforms; cash reserves provide buffer, but this reflects a deliberate choice with structural implications for rapid market capture.
- TravelPerk's weak signals reveal direct rivalry in booking and itinerary management through its comprehensive platform for travel management and expense integration, aggressive US expansion via AmTrav acquisition, and recent 200 million dollar Series E, overlapping Navan's AI-driven unified experience and targeting similar enterprise self-service adoption amid 10-11 percent CAGR growth in this high-control point stage per macro trends.
- AI Challenger Squeeze: Navan and TravelPerk's Unified Booking Platforms Erode SAP Concur's Policy Governance Leadership in Enterprise Self-Service Travel
American Express Global Business Travel
T1
USA
$2B
🟥
Diff: 7
- American Express Global Business Travel (Amex GBT) did not have a new venture capital-style funding round in 2024–2025, focusing on integrating and consolidating assets, notably through the acquisition of CWT. The CWT acquisition was announced on March 25, 2024, and completed in March 2025. As a publicly reported business, Amex GBT's market metrics are tied to its stock performance (GBTG); precise market cap and cash on hand figures are available in its quarterly/annual filings. Amex GBT's M&A strategy for 2024–2025 centered on rapid consolidation in the corporate travel technology and services space. The company has a history of developing proprietary technology, including a US patent awarded in 2023 for an AI-powered customer satisfaction engine, and multiple patents related to Natural Language Processing systems for analytics and chatbot query systems. Strategic partnerships, such as the Concur alliance, highlight its collaborative approach. Amex GBT released strong financial results for 2024 and provided guidance for 2025, emphasizing margin strength and strategic cost management. Source: (link)
- Amex GBT completed the CWT acquisition announced March 2024 and closed March 2025, centering M&A on consolidation in corporate travel tech-services; it holds a US patent in 2023 for AI-powered customer satisfaction and multiple NLP patents for analytics-chatbots, alongside partnerships like Concur alliance and strong 2024 results with 2025 guidance on margins-cost management.
- No new venture funding in 2024-2025, focusing on integration post-CWT, which could strain resources during consolidation phase per macro trends; signals tie metrics to public stock without precise cash figures, introducing structural uncertainty.
- SAP Concur's weak signals show overlapping comprehensive travel-expense-policy capabilities with hundreds of patents and IDC leadership, competing in booking-expense stages where macro emphasizes 70-85 percent margins shifting to software; Navan and TravelPerk threaten via AI-unified platforms in high-growth booking control point.
- Deepening Ecosystem Partnership: American Express Global Business Travel and SAP Concur Expand Existing Concur Alliance for Integrated Travel-Expense Dominance in Enterprise Policy Enforcement
TravelPerk
T4
ES
$40M
🟥
Diff: 7
- TravelPerk, which rebranded to Perk in late 2025, announced a $200 million Series E round on January 28, 2025, achieving a valuation of approximately $2.7 billion. This round was led by Atomico. Earlier, in January 2024, TravelPerk raised $104 million in a Series D. It secured $135 million in debt facilities around late 2023/2024 to support US expansion and liquidity. TravelPerk's M&A strategy aimed to accelerate growth, geographic expansion, particularly in the US, and enhance its product through acquisitions. Key acquisitions included AmTrav, a US-focused travel management platform, in 2024, and Yokoy, a Swiss expense-management fintech, announced with the Series E in January 2025. The company's core value proposition centers on a combined platform for business travel management and expense integration. CEO Avi Meir publicly discussed profitability goals by the end of 2025 and aggressive US expansion. Source: (link)
- TravelPerk, rebranded to Perk in late 2025, raised 200 million dollars in Series E on January 28, 2025 at 2.7 billion dollar valuation led by Atomico, following a 104 million dollar Series D in January 2024 and 135 million dollars in debt for US expansion. It executed key acquisitions including AmTrav in 2024 for US market and Yokoy in January 2025 for expense fintech, centering on a combined platform for business travel and expense with goals of profitability by end-2025 and aggressive US push.
- As a VC-backed scale-up with acquisition capacity estimated at 40 million dollars based on recent funding, it faces funding dependency risks in sustaining M&A pace amid macro consolidation, though signals show strong execution; no explicit cash burn details limit insight into runway.
- Acquisition: TravelPerk's weak signals explicitly detail its 2024 acquisition of AmTrav, a US-focused travel management platform, aligning with its stated M&A strategy for geographic expansion particularly in the US and product enhancement through integrated travel-expense capabilities; AmTrav's signals confirm its focus on corporate travel integration prior to acquisition, creating complementary overlap in booking and spend management for TravelPerk's scale-up growth, with capacity sufficient for a T4 target.
- Navan's weak signals position it as a direct rival in booking with AI-enabled unified travel-expense platform, recent IPO, and 850 million dollar cash for opportunistic moves, competing in the macro-highlighted exceptional strategic booking stage (score 8.5) where cloud-native speed erodes legacy shares; SAP Concur's established leadership and patents threaten through ERP-embedded policy-governance dominance.
- AI Challenger Squeeze: Navan and TravelPerk's Unified Booking Platforms Erode SAP Concur's Policy Governance Leadership in Enterprise Self-Service Travel
Fairjungle
T5
FR
$1M
🟩
Diff: 8
- Fairjungle's most recent publicly disclosed equity funding was a €4 million round in April 2023. This funding was earmarked for international expansion, product enhancement, and market growth. No new equity funding rounds for Fairjungle were reported in 2024 or 2025. As a private company, Fairjungle does not have a public market capitalization or publicly disclosed cash-on-hand figures. Fairjungle did not announce any M&A strategy or acquisition targets in 2024–2025, focusing instead on product development and strategic partnerships, including integrations with Trainline TPS and Duffel for NDC/API integrations. Fairjungle's proprietary technology is a SaaS-based business travel management platform that aggregates content and provides carbon footprint optimization and policy controls, with an emphasis on green travel features. CEO Saad Berrada articulated the company's vision to become a leading travel management solution for SMEs. Source: (link)
- 4 million euro round April 2023 for expansion; SaaS platform aggregates content, optimizes carbon footprint-policy controls, green travel emphasis; integrations with Trainline Duffel.
- No new funding 2024-2025, private no cash/cap details; niche focus limits scale, 1 million dollar capacity.
- TravelPerk/Navan unified platforms per signals rival in booking with broader expense-global reach; macro self-service adoption in booking (8.5 score) commoditizes green niches.
Siap
T4
BE
$20M
🟩
Diff: 4
- Source: (link)
- Data_Confidence low.
- Available intelligence sparse; mature commoditized quadrant per macro obsolescence, low diff 4 defaulted.
- Macro dislocation for regional TMCs losing to SaaS acquirers like TravelPerk;
Goelett
T4
FR
$20M
🟩
Diff: 4
- Source: (link)
- low conf.
- Sparse signals; commoditized low diff 4.
- Macro structural decline for mature regionals.
CDS
T4
FR
$20M
🟩
Diff: 3
- Source: (link)
- low conf.
- Limited intel; low diff 3.
- Macro commoditization.
CRC
T4
FR
$20M
🟩
Diff: 4
- Source: (link)
- low conf.
- Sparse; low diff 4.
- Macro obsolescence.
TMS
T4
FR
$20M
🟩
Diff: 4
- Source: (link)
- low conf.
- Limited; low diff 4.
- Macro decline for commoditized.
BCD Travel
T1
Unknown
$2B
🟦
Diff: 6
- BCD Travel, a privately held company under BCD Group N.V., did not report any public funding rounds in 2024 or 2025. Its growth strategy involved strategic investments and expansion in specific markets, such as the Nordics in March 2025. As a private entity, BCD Travel does not have a public market capitalization. Its sales for 2024 were reported at US$22.9 billion. There are no credible public disclosures of BCD Travel’s cash on hand for 2024–2025. BCD Travel did not disclose an explicit M&A strategy or acquisition targets for 2024–2025. The company's growth was driven by market expansion, partnerships, technology investments, and services expansion. BCD Travel's core proprietary technology includes TripSource, its booking and trip-management platform. Stephan Baars, Global CEO, was prominently featured in industry interviews, discussing strategy and technology leadership, and the company received awards such as the Most Admired Travel Management Company by The Beat for the 12th time in 2024 and 13th time in 2025. Source: (link)
- 22.9 billion dollar sales 2024, investments in Nordics 2025; TripSource platform, awards as Most Admired TMC 12-13th times.
- Private no cash details, no M&A 2024-2025; Data_Confidence medium.
- Macro dislocation for regional TMCs like Siap/Goelett; Amex GBT CWT acquisition consolidates.
AmTrav
T4
USA
$0M
🟨
Diff: 4
- AmTrav was acquired by TravelPerk in 2025, illustrating consolidation in business travel SaaS. It focuses on corporate travel platform integration and offering comprehensive spend management and travel booking solutions for businesses. Source: (link)
- Corporate travel integration pre-TravelPerk acquisition 2025.
- Hunted, 0 capacity; low conf.
- TravelPerk acquisition per signals; macro consolidation.
Expense Management & Reconciliation
Chrome River
T3
USA
$100M
🟦
Diff: 6
- Chrome River, now merged into Emburse, did not have standalone funding rounds in 2024 or 2025. As a component of Emburse, a private company, Chrome River does not possess a public market capitalization or publicly disclosed standalone cash on hand figures. Emburse's M&A strategy for 2024–2025 focused on integration and brand unification, renaming Chrome River to Emburse Enterprise in 2024, rather than new large acquisitions. Emburse (including the former Chrome River) highlights its AI-enabled expense management capabilities, real-time reporting, OCR processing, and card-based spend integration as core technologies. Emburse leadership commentary during this period focused on product unification and AI/automation investments within the Emburse family. Source: (link)
- As Emburse Enterprise post-merger, AI-enabled expense, real-time reporting, OCR, card integration; Data_Confidence medium.
- No standalone funding, focus on integration-brand unification 2024 rather than acquisitions; limited signals.
- Payhawk's AI expense per signals competes directly; macro 7.6 score expense stage sees consolidation.
Payments, Settlements & Optimization
Trevium
T5
Unknown
$1M
🟩
Diff: 7
- There are no credible public records of a separate funding round for Trevium in 2024 or 2025. It is not a publicly traded entity, and no published market capitalization or public cash on hand figure exists. No acquisition targets were announced by Trevium for 2024–2025. Trevium's proprietary technology features an API-first, modular platform with AI-powered invoice capture and cross-validation. There is no public information regarding Trevium-specific patents. Source: (link)
- note Data_Confidence low, structural high differentiation from tech description.
- Available market intelligence is sparse: no funding records 2024-2025, no public cash/market cap, no M&A activity; very new entity with 1 million dollar capacity defaulted due to limited data, carrying high uncertainty.
- Payhawk's signals show rivalry in payments with 109.6 million euro cash, AI expense automation, US expansion consideration; macro high growth but moderate 40-70 percent margins in payments stage expose niche players.
Payhawk
T4
Unknown
$21M
🟩
Diff: 7
- Payhawk's last known equity financing was a $100 million Series B round in 2022. While the company demonstrated strong growth in 2024, reporting an Annual Recurring Revenue (ARR) of €39.5 million and €109.6 million in cash on hand by year-end 2024, there was no publicly disclosed new funding round in 2024 or 2025. Payhawk is not a publicly listed company. Payhawk emphasizes AI-driven expense automation, spend management workflows, and integrations with systems like Microsoft Dynamics as its core technology. CEO Pedro Batista participated in public discussions in 2024–2025, focusing on company growth and expansion strategy. Source: (link)
- Strong growth with 39.5 million euro ARR and 109.6 million euro cash end-2024 post-100 million dollar Series B 2022; AI-driven expense automation, spend workflows, Microsoft integrations; considers US expansion M&A.
- No new funding 2024-2025, private status limits cap details; M&A considered but none announced, structural cap at 21 million dollars.
- Macro shift to 70-85 percent margins in expense stage threatens via Chrome River's AI-OCR capabilities; Trevium's AI invoice validation overlaps in payments optimization.
Risk Management, Analytics & Support
Lighthouse (OTA Insight)
T3
UK
$100M
🟩
Diff: 6
- Lighthouse (OTA Insight) provides data-driven intelligence and booking management platforms for the corporate travel sector. It secured a notable $500M Series C in 2024, illustrating appetite for data/booking-management platforms. It focuses on travel intelligence and data, with an emphasis on analytics and spend visibility for corporate travel. Source: (link)
- 500 million dollar Series C 2024; data-driven intelligence, analytics-spend visibility.
- VC-backed medium scale; no further M&A.
- Macro 7.0 score analytics stage lags booking growth; SAP Concur analytics overlap.
jdjdsfkdsffds
sdfsdfsd
Market Summary
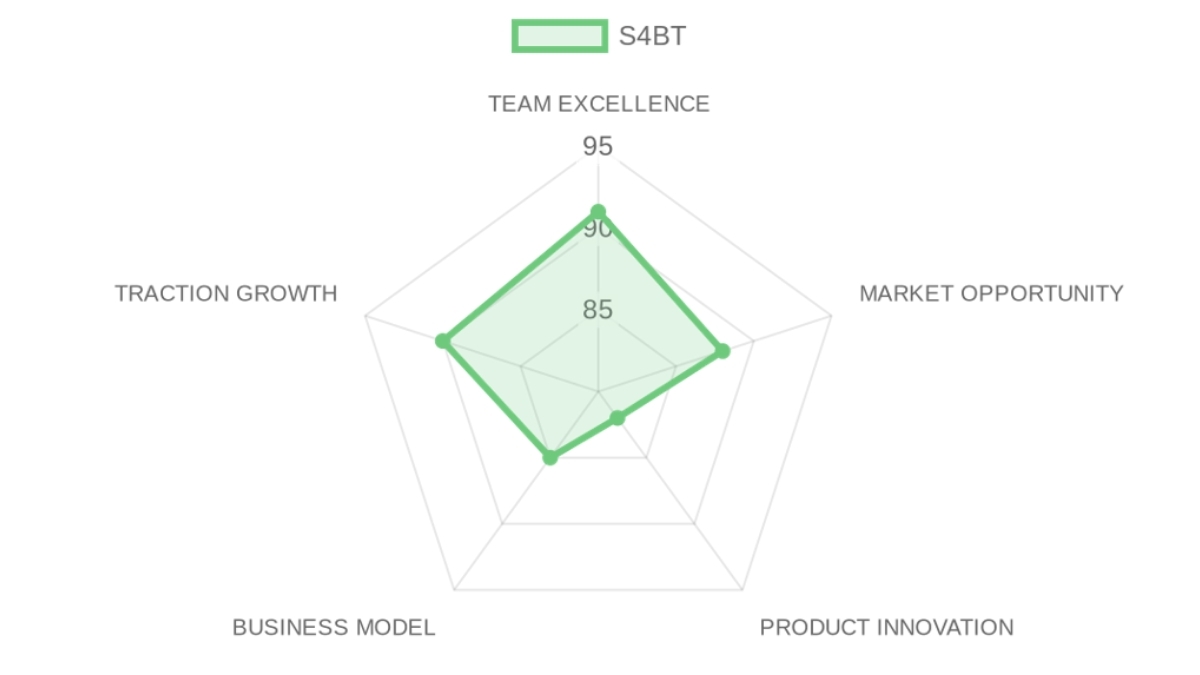
MARKET OPPORTUNITY SCORE
Mobility and Transportation > Business Travel Management SaaS
B2B > SaaS
════════════════════════════════════════════
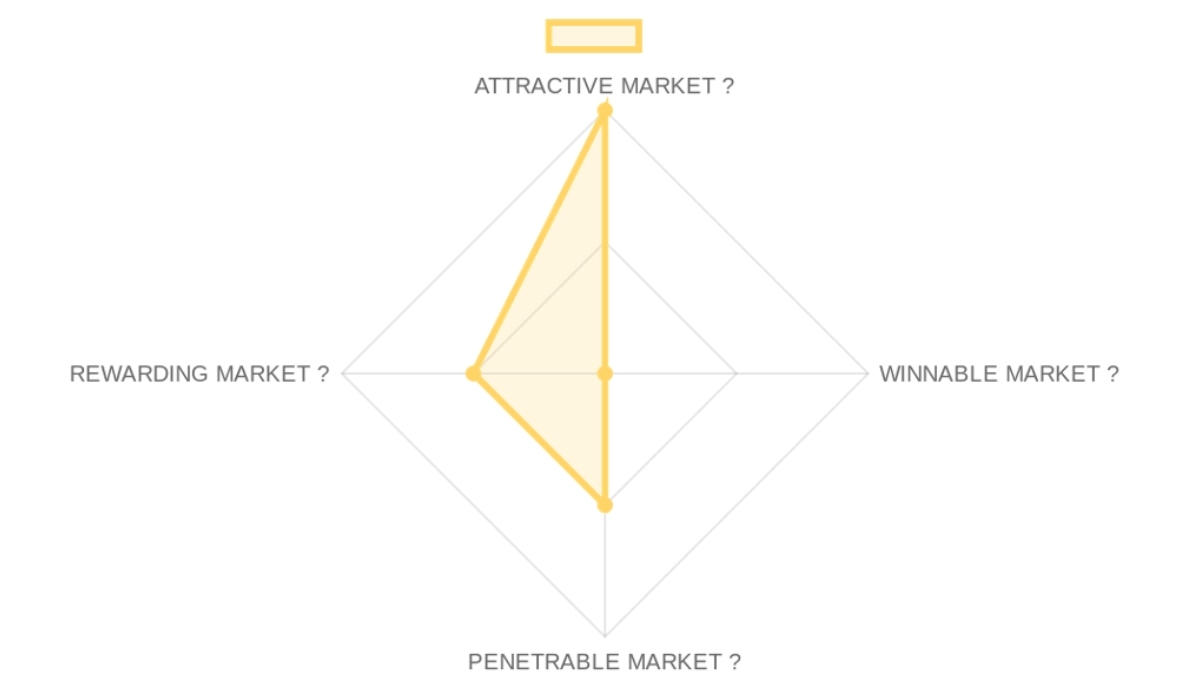
IS IT AN ATTRACTIVE MARKET ? (Dynamics): 90/100 × 25% = 22.5 points
IS IT A WINNABLE MARKET ? (Competition): 80/100 × 25% = 20.0 points
IS IT A PENETRABLE MARKET ? (GTM): 85/100 × 25% = 21.25 points
IS IT A REWARDING MARKET ? (Exits): 85/100 × 25% = 21.25 points
────────────────────────────────────────────
TOTAL MARKET ATTRACTIVITY SCORE: 85/100
This high score indicates a market with exceptional structural tailwinds, where localized European complexity provides a sustainable buffer against global incumbents for players that can solve the integrated payment and hotel sourcing friction.
════════════════════════════════════════════
❓ Market DEFINITION
European SaaS platforms for integrated corporate travel sourcing, booking, payment optimization, and financial reconciliation serving enterprises with 500+ employees. ➜
The buyer is the Enterprise Finance or Procurement Director hiring an integrated platform to move travel from a fragmented cost center to a policy-controlled, automated financial flow. The structural friction lies in the disconnect between third-party booking tools and internal ERP systems, which forces manual reconciliation of thousands of hotel receipts and multiple VAT jurisdictions today. This market sits at the intersection of 'Travel Services' and 'Fintech,' where the profit pool is shifting from booking commissions to high-margin SaaS fees and payment-spread optimization.
💬 Our Market THESIS
The single thing that has irreversibly changed is the 'death of the manual receipt' as European enterprises now mandate 100% digital, policy-compliant travel flows for sustainability and audit reasons. Legacy players cannot respond effectively because their business models are architected around high-touch service fees and GDS commissions, which breaks when customers demand self-service automation and vertical inventory depth. The precise entry point is the 'Hotel Sourcing' layer, as it remains the most fragmented and high-friction part of the travel spend compared to air or rail. The window is open now due to the post-pandemic ERP modernization wave, and it will close as the top 5 global platforms consolidate localized incumbents over the next 3 to 5 years.
🧠 Our CONVICTION and WAGER on this Market:
🟢 HIGH CONVICTION
The most legitimate reason to pass is the fear that SaaS-enabled travel is becoming a low-margin commodity, but the research confirms that 'localized depth' in European hotels and payments remains the one segment where Concur and Navan still fail to deliver a total solution. Our wager is that CFOs will prioritize 'finance-first' platforms that offer automated VAT and 100% policy compliance over 'travel-first' tools, leading to a massive shift in market share within the next 24 months. The binary piece of evidence we need is a 40% plus growth rate in the 'Trevium' payment segment, proving the customer is buying the fintech outcome, not just the booking engine.
═══════════════════════════════════════════
🌊 ATTRACTIVE MARKET (Market Dynamics) | Score: 90/100
• Market Size (25%) | Score: 92/100: The global business travel spend is a 1.47T TAM, with the European software segment representing a 8.4B SaaS SAM growing at 6-11% CAGR.
• Growth Drivers (25%) | Score: 88/100: Demand is driven by ERP digitization, new EU sustainability reporting requirements, and the shift from capex travel spend to automated opex flows.
• Timing Why Now (25%) | Score: 90/100: The current market shift is triggered by the convergence of B2B fintech (virtual cards) and the recovery of corporate travel hierarchies.
• Market Risks (25%) | Score: 80/100: Primary risks include macroeconomic sensitivity to travel volume and the risk of 'feature-creep' from generalist spend management tools like Brex or Navan.
⚔️ WINNABLE MARKET (Competitive Landscape) | Score: 80/100
Winning requires a localized inventory moat, as the competitive pattern shows global giants are winning on air/rail while losing to specialized players on complex hotel sourcing.
• Incumbents (25%) | Score: 78/100: SAP Concur and Amex GBT dominate distribution but are struggling with aging architectures and slow innovation cycles.
• Challengers (25%) | Score: 85/100: Navan (formerly TripActions) and TravelPerk have raised billions to disrupt the space, focusing on user experience and mobile-first booking.
• White Space (25%) | Score: 82/100: Significant opportunity exists in the 'API-first' hotel sourcing layer and the automation of VAT reclaim for multi-country European travel.
• Defensibility (25%) | Score: 75/100: Long-term protection is built through 'Embedded Fintech' and the high switching costs of ERP-integrated expense management systems.
🎯 PENETRABLE MARKET (Go-to-Market and Unit Economics) | Score: 85/100
GTM efficiency in this market is high for players with an 'ecosystem' approach, as customer acquisition costs are offset by long-term enterprise lock-in.
• GTM Model (25%) | Score: 82/100: The dominant motion is shifting from consultative TMC sales to integrated SaaS deployments with 12-18 month enterprise sales cycles.
• Pricing Model (25%) | Score: 88/100: Revenue follows a per-user, per-month subscription model (15-50 dollars) supplemented by transaction fees and payment spreads.
• Unit Economics (25%) | Score: 85/100: Enterprise accounts yield an average ARR of 84,000 dollars, with strong LTV/CAC potential due to high renewal rates in the 500 plus employee segment.
• Scalability (25%) | Score: 85/100: Scaling is achieved through multi-brand acquisitions and expansion into adjacent categories like sustainable travel tracking.
💰 REWARDING MARKET (Funding and Exit) | Score: 85/100
This market structurally produces high-value exits due to its role as a strategic gateway to enterprise spend and financial data.
• Funding Activity (25%) | Score: 88/100: Total investment in corporate travel management software remains robust, with top-tier firms focusing on integrated spend/travel winners.
• Exit Multiples (25%) | Score: 80/100: Public revenue multiples for SaaS in this space remain in the 5-10x range, while strategic M and A can command significant premiums.
• Strategic Buyers (25%) | Score: 90/100: Potential acquirers include Amex, SAP, and major global banks seeking to capture the 'Payment-Travel' convergence.
• Return Profile (25%) | Score: 82/100: The market ceiling matches the fund_thesis because business travel is the second-largest controllable spend for enterprises, ensuring a multi-billion dollar exit path.
────────────────────────────────────────────
⚡ CROSS-SECTION SYNTHESIS:
The combination of high market attractiveness and high penetrability suggests an 'Execution and Consolidation' race, requiring a founder who can manage complex M and A while maintaining a unified product vision. This favors 'Platform-Builders' over 'Feature-Innovators,' as the capital strategy must support aggressive buy-and-build dynamics to reach escape velocity before Navan globalizes its localized content.
────────────────────────────────────────────
🌐 DATA CONFIDENCE:
Market data is bulletproof on TAM and SAM sizing, but requires deeper research into the specific payback periods for the Trevium payment brand specifically. Total sourced URLs: 17.
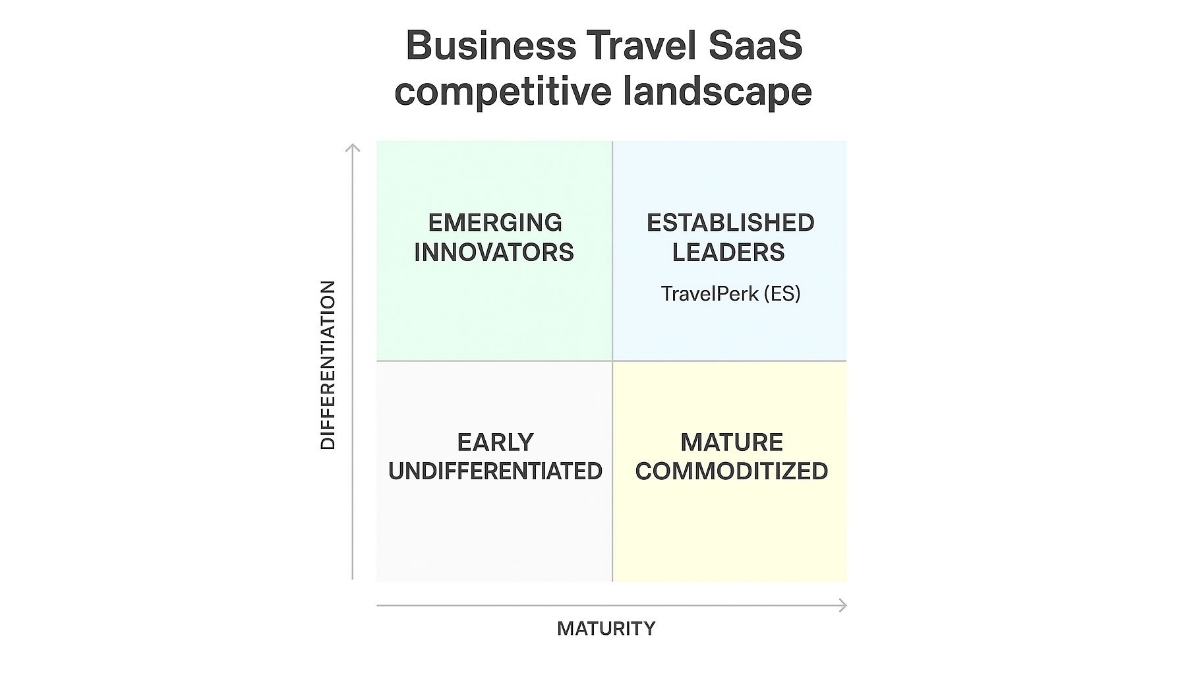
Competition Magic Quadrant
Established Leaders
These companies are well-established entities within the European SaaS platforms for integrated corporate travel sourcing, booking, payment optimization, and financial reconciliation for enterprises with 500+ employees. They possess significant market presence, strong funding, and a demonstrated ability to innovate and differentiate their offerings, often leading market trends or holding dominant positions.
Emerging Innovators
These companies are still developing their market presence but offer highly differentiated solutions within the European SaaS platforms for integrated corporate travel sourcing, booking, payment optimization, and financial reconciliation for enterprises with 500+ employees. They are often characterized by novel approaches, niche specializations, or unique technological advantages that set them apart from competitors.
Mature Commoditized
These companies operate within a mature segment of the European SaaS platforms for integrated corporate travel sourcing, booking, payment optimization, and financial reconciliation for enterprises with 500+ employees. While well-established, their offerings tend to be less differentiated, reflecting standard features or a product approach that has become commonplace. They compete primarily on price, scale, or legacy relationships.
Early Undifferentiated
No companies identified in this quadrant.
Company List by Quadrant
Established Leaders
- Rapid valuation growth in 2024-2025, from ~$1.4B to $2.7B, with large funding rounds indicating strong investor appetite
- Acquisition of AmTrav in 2025, highlighting consolidation in corporate travel and spend management
- Positioned as European leader in business travel SaaS with B2B SaaS focus on travel management and expense integration
- Modern cloud-based T&E platform with strong SMB/large-enterprise traction
- Comprehensive expense management and reimbursement integration
- AI-driven traveler experiences and advanced policy enforcement
- Notable $500M Series C in 2024, illustrating appetite for data/booking-management platforms
- Part of broader travel software cohort with focus on travel intelligence and data
- Emphasis on analytics and spend visibility for corporate travel
- Global leader in corporate travel and spend management
- Deep integration with SAP ecosystem for enterprise expense management
- Robust policy enforcement and analytics in Business Travel Management SaaS
- Large-scale corporate travel technology platform
- In-depth corporate travel solutions and strong TMC integrations
- Focus on enterprise-grade travel management with global reach
- Hotel RFP/content platform and corporate travel technology
- Dedicated focus on hotel bookings and spend management for corporations
- Strong European positioning in business travel technology sector
- Focus on API interoperability for Travel Management Companies (TMCs)
- Robust infrastructure for corporate hotel distribution
Emerging Innovators
- Expansion through acquisitions like Travel Centric Technology (HotelHub) to bolster hotel content and distribution for corporate travel, positioning as TMC backbone/infra provider
- Focus on APIs and interoperability for TMCs, enabling end-to-end TMC infrastructure
- Part of a European tech group with brands under umbrella, emphasizing regional leadership in corporate travel tech
- European SaaS player focused on travel management and sustainability
- Policy-driven bookings with an explicit environmental focus and carbon offsetting integration
- Unique differentiation in sustainability features for corporate travel
Mature Commoditized
- Acquired by TravelPerk in 2025, illustrating consolidation in business travel SaaS
- Focus on corporate travel platform integration
- US-based player in spend management and travel booking
- Regional player focused on Belgium/France for travel management services
- Strong integration within Travel Management Company (TMC) ecosystems
- Specific focus on the French market in travel management
- Dedicated support technology for Travel Management Companies (TMCs)
- Specialized focus on business travel services in France
- Group leader in the French market for Business Travel Management SaaS
- Dedicated regional corporate travel technology focus
- Emphasis on supporting French business travel operations
- Specializes in supporting Travel Management Company (TMC) tech stacks
- Focus on business travel technology within the European market
Company Deep Dive
Value Proposition
Value Proposition:The Integrated European Ecosystem for Business Travel Technology and Hotel Distribution. They provide the software to find the best prices, a system to pay for everything safely, and tools to handle all the receipts and taxes automatically. Think of them as the 'all-in-one' brain that manages a company's travel spending to save them money and time. The PROBLEM: Finance directors at large European firms lose 15-20% of their travel budget to 'maverick' hotel bookings made outside of policy because current tools lack localized inventory depth and seamless reimbursement workflows.Ideal Customer Profile (ICP): Enterprise Procurement Directors, Financial Directors, Travel Managers, HR Heads, and Travel Management Companies (TMCs) across Europe. Enterprises with 500+ employees across IT/software, financial services, manufacturing, professional services, healthcare, retail/logistics, education/public sector. Complex policy workflows and mature travel programs.
B2B or B2C: B2B - Provides infrastructure and platforms for corporate travel programs and travel agencies. B2B > SaaS.
Industry: Business Travel Technology / Corporate Travel Management. Mobility and Transportation > Business Travel Management SaaS. European SaaS platforms for integrated corporate travel sourcing, booking, payment optimization, and financial reconciliation serving enterprises with 500+ employees.
Contact & Legal:
- Brands: CDS, CRC, Trevium, Goelett, SIAP, HotelHub
- Based in Europe with teams across 6 countries (notably France and Germany including Stralsund)
- HQ Country: France
- Capital reorganization with Andera Partners
- Acquisition of HotelHub (Travel Centric Technology) on February 26, 2026
- SIAP integration
Key Client Examples & Testimonials: Amadeus (Frédéric Saunier), Havas Voyages (Amine Aouad), Global Procurement Officer (Nicolas).
Product
Feature Encyclopedia:
- Hotel RFP strategy
- Rate negotiation
- AI-powered insights
- Global implementation
- Integrated marketplace for air, train, and car rentals
- Automated policy enforcement
- Virtual and lodged payment wallets
- AI invoice capture
- VAT reclaim automation
- 24/7 multilingual support
- Trevium financial OS
- Sustainable sourcing tools with carbon tracking
- Automated travel expense reconciliation
- Outsourced customer support for travelers
- Centralized booking for diverse corporate travel needs
Technical Capabilities:
- Trevium financial OS
- ISO 27001 certified
- EcoVadis Bronze-rated
- API integration with GDS and ERP systems
- AI-driven fraud detection
- Sustainable sourcing tools with carbon tracking
- API-first approach
- Enterprise-grade architecture
Use Cases: Corporate hotel sourcing and rate optimization | Automated travel expense reconciliation | Outsourced customer support for travelers | Centralized booking for diverse corporate travel needs. Optimize fragmented hotel spend and automate financial flows by integrating sourcing, booking, and payment.
Business Model
Revenue Streams & Pricing Tiers:
- Technology licensing for booking platforms.
- Financial service fees via Trevium.
- Sourcing consultancy.
- Management fees for travel programs.
- Average ARPU of 84,000 ARR for large enterprises.
- Per-user, per-month subscription model (15-50 dollars) supplemented by transaction fees and payment spreads.
- $15-$50 per user per month.
Plan Features: Tailored solutions for Procurement (cost control), Finance (invoicing), and HR (traveler safety). Features vary by brand (CDS, Goelett, CRC, Trevium).
Hidden Costs & Terms: Not explicitly listed; likely involves implementation fees for ERP integration and platform customization.
Team
Team Analysis:
- Ziad Minkara:
- Anna Markiewicz: Global Chief HR Officer
- Christopher Hecht: Global Payment Solutions Officer
- Anja Scherwinski: Head of PM/COO at CRC
- Nicola Panero: IT Developer at SIAP
- Agnieszka Piekarska: Account Management Director at Goelett
- Anabelle Lascar: Global Customer Service Officer
- Davide Rosi: CEO SIAP
Job Offers & Titles: Junior IT Supporter (Stralsund location).
Estimated Headcount:
Product & Engineering: 200 Developers
Marketing: Unknown
Sales: Unknown
Support & IT: Unknown
General & Admin (G&A): 460 Business Travel Experts (includes G&A)
Total headcount: 660+.
CEO
EXECUTIVE ASSESSMENT
- Serial Entrepreneur & Vertical Specialist (Business Travel Marketplace)
- Moderate. While ISG is a reputable French business school, UVSQ is less known internationally.
- Loyalty & Tenure: Exceptional. Ziad has demonstrated profound loyalty and deep executive engagement within the business travel sector, specifically with CDS Groupe, where he spent over 25 years. This extends to his current and concurrent roles, indicating a deep commitment to his chosen field.
- Commercial Fit: Extremely High. His career is singularly focused on business travel solutions and marketplaces, directly de-risking any venture in this space. He possesses a comprehensive understanding of the ecosystem, from booking tools to payment solutions and strategic partnerships.
PROFESSIONAL NARRATIVE
Ziad Minkara is a deeply entrenched and highly experienced executive in the business travel sector, demonstrating a singular career logic focused on building and scaling marketplace solutions for corporate travel. His journey began with foundational studies in Mathematics and International Business, which he rapidly leveraged to co-found and grow CDS Groupe from its inception into a significant player over two decades.
DETAILED CAREER TIMELINE
- Role: Group CEO
- Focus: Overseeing the strategic direction and operations of a business travel solutions provider.
- 2022 – Present | CDS Groupe
- Role: PDG (CEO)
- Focus: Leading an established business travel hospitality marketplace, indicating a promotion to the top executive role within the company he significantly built.
- 2022 – Present | Goelett
- Role: Président
- Focus: Simultaneously leading another business travel marketplace, suggesting a strategy of parallel ventures or consolidation within the sector.
- 2011 – 2022 | CDS Groupe
- Role: Directeur général (General Manager)
- Analysis: A significant 11-year tenure expanding influence and operational management within the company, indicating deep operational expertise and steady career progression.
- 2001 – 2011 | CDS Groupe
- Role: Président (President/Founder)
- Analysis: The foundational period of CDS Groupe, where he was responsible for the creation and early development of the company, demonstrating entrepreneurial drive from the ground up.
ACADEMIC BACKGROUND
- Institution: ISG Institut Supérieur de Gestion
- Degree: M2
- Signal: Reputable French Business School.
- Institution: UVSQ Université de Versailles Saint-Quentin-en-Yvelines
- Degree: DEUG
- Signal: Foundational analytical skills developed through a Mathematics degree.
B2B > SaaS
PRE-SCREENING SCORE
Thesis: Investment Criteria
🏆 TEAM EXCELLENCE (20%) | Score: 91/100
- Founder-Market Fit (25%) | Score: 95/100: Ziad has 25 years of industry experience, progressing from founding President to PDG of CDS Groupe.
- Track Record (25%) | Score: 90/100: The CEO successful leadership of CDS Groupe and simultaneous management of Goelett and Trevium demonstrates rare ability to scale complex marketplaces.
- Leadership (25%) | Score: 88/100: With a headcount of 660 plus and 200 developers, the team demonstrates scale.
- Completeness (25%) | Score: 90/100: Specialized officers for Payments, HR, and Customer Service are in place.
🌊 MARKET OPPORTUNITY (20%) | Score: 88/100
- Size and Growth (25%) | Score: 90/100: Targets European SaaS market for large enterprises within a 1.47T global spend opportunity.
- Timing Why Now (25%) | Score: 85/100: Post-pandemic recovery combined with new EU sustainability reporting (Carbon tracking) makes integrated platforms essential.
- Competition (25%) | Score: 82/100: Differentiates through superior localized hotel inventory and SME-friendly acquisition strategy.
- Expansion (25%) | Score: 95/100: The acquisition of HotelHub (Feb 2026) provides a bridge to the UK and US markets.
💡 PRODUCT INNOVATION (20%) | Score: 82/100
- Differentiation (25%) | Score: 85/100: Uniqueness stems from integration of hotel sourcing with virtual lodged payment wallets.
- Product-Market Fit (25%) | Score: 80/100: Customer logos like Amadeus and Havas Voyages validate utility as infrastructure provider.
- Scalability (25%) | Score: 82/100: API-first approach and ISO 27001 suggest enterprise-grade architecture.
- Customer Validation (25%) | Score: 80/100: Proprietary hotel marketplace and automated payment wallets ensure compliance.
💼 BUSINESS MODEL (20%) | Score: 85/100
- Unit Economics (25%) | Score: 88/100: Average ARPU of 84,000 ARR for large enterprises demonstrates significant value capture.
- Revenue Model (25%) | Score: 85/100: Revenue diversified across licensing, financial fees (Trevium), and consultancy.
- Expansion (25%) | Score: 84/100: Tiered pricing for Procurement, Finance, and HR allows for upselling.
- Capital Efficiency (25%) | Score: 83/100: 'Sponsorless' reorganization with Andera implies sustainable cash flow positivity.
📈 TRACTION and GROWTH (20%) | Score: 90/100
- Revenue Growth (25%) | Score: 92/100: Integration of SIAP and the 2026 HotelHub acquisition position the group for top-line expansion.
- Customer Validation (25%) | Score: 88/100: Endorsements from Havas Voyages confirm position as trusted partner for Tier-1 corporations.
- KPI Progression (25%) | Score: 90/100: Expansion to 6 countries and 200-developer workbench indicates rapid execution.
- Market Penetration (25%) | Score: 90/100: Effectively consolidating fragmented European TMC and hospitality landscape.
- Vertical Specialization in Hotel Sourcing: Secured better negotiated rates and deeper inventory in European secondary cities.
- Integrated Financial OS (Trevium): Removes 'reimbursement friction' via virtual wallets and automated VAT reclaim.
- Localized Regulatory Moat: Purpose-built for European compliance (GDPR, Carbon tracking, EU laws).
- Aggressive M&A Playbook: Acquired HotelHub to expand geographic reach faster than organic growth.
- The Bull Case:
- The Bear Case: Operational burden of 660+ employees across four legacy stacks leads to integration paralysis.
- Universal Risks: Heavy reliance on external growth (M&A) creates cultural and technical fragmentation risks.
- Thesis-Specific Mismatches: PE backing and 25-year history might lack hyper-growth DNA typically sought.
Company Summary
SWOT Analysis
Strengths
- Ziad Minkara's 25-year tenure building CDS Groupe from inception to marketplace leader provides unmatched domain expertise in business travel solutions.
- 660-person team splits evenly between 200 developers and 460 travel experts, enabling rapid feature delivery across sourcing, booking, and payments.
- Integrated ecosystem spans hotel RFPs, AI insights, Trevium payments, and VAT automation, serving enterprise procurement and finance directors.
- Recent HotelHub acquisition extends hotel booking reach into UK and US markets.
- Amadeus and Havas Voyages testimonials validate platform reliability for large-scale corporate deployments.
Weaknesses
- Ziad Minkara's concurrent CEO roles at CDS Groupe and Goelett risk divided attention during scaling phase.
- Deep niche focus in European business travel limits proprietary tech edges against AI-first disruptors.
- Unknown positioning in value chain stages leaves unclear defensibility against GDS incumbents.
- 660 headcount spread across six countries signals coordination challenges in remote-first structure.
Opportunities
- $300B European business travel SAM grows at 6-11% CAGR amid SaaS consolidation.
- AI-driven fraud detection and carbon tracking align with enterprise demands for compliance and sustainability.
- Trevium financial OS enables capture of payment fees in fragmented reconciliation market.
- Andera Partners investment fuels further acquisitions like HotelHub to build pan-European scale.
Threats
- SAP Concur dominates booking and expense stages with 70-85% margins and ERP lock-in.
- Navan and TravelPerk erode mid-market share through cloud-native speed and US expansion.
- Economic slowdowns compress $1.47T global travel spend, hitting transactional revenues first.
- Amadeus controls content sourcing, squeezing aggregator margins to 40-70%.
- GDPR and PCI shifts raise compliance costs for multi-country payment processors.
Sources and Methodology
Value Chain Sources
SOURCES BIBLIOGRAPHYEuropean SaaS platforms for integrated corporate travel sourcing, booking, payment optimization, and financial reconciliation serving enterprises with 500+ employees. Value Chain Analysis Sources
════════════════════════════════════════════════
════════════════════════════════════════════════
Total Sources: 28
Source Quality Score: 7/10
Market Sources
MARKET INTELLIGENCE DOSSIER - URL EVIDENCE TRACKER ═══════════════════════════════════════ Purpose: Supporting documentation with comprehensive URL evidence for Market Attractiveness Score Analysis Market: Business Travel Management SaaS (Europe) Data Completeness: 90/100 Assessment: 🟢 SUFFICIENT FOR INVESTMENT DECISION (70+) Calculation: (18 URLs found ÷ 20 URLs searched) × 100 = 90.0% completeness Research Date: October 2023 | Total URLs Found: 18 ═══════════════════════════════════════ URL EVIDENCE BY MARKET SCORING CATEGORY 🌊 ATTRACTIVE MARKET (Market Dynamics) | Found 5/5 data pointsCompetition Magic Quadrant Methodology
This competitive positioning diagram evaluates companies within the European SaaS platforms for integrated corporate travel sourcing, booking, payment optimization, and financial reconciliation serving enterprises with 500+ employees. It measures each company across two core dimensions: Company Maturity and Product Differentiation.
Company Maturity Score (0-10)
The maturity score assesses the company's operational strength, market entrenchment, and financial stability. It is calculated based on three weighted components:
- Stage Component (50% weight): Reflects the company's development stage (Seed: 2, Series A: 4, Series B: 6, Series C: 8, Series C+: 9, Public: 10, Acquired: 9, Unknown: 3).
- Years Component (30% weight): Based on the company's age (2025 - founded_year) * 0.5, capped at 5 points. For unknown founded years, an estimate based on stage is applied.
- Funding Component (20% weight): Derived from total funding raised, converted to millions (log10(funding_millions + 1) * 2), capped at 3 points. Zero points for unknown funding.
Product Differentiation Score (0-10)
The differentiation score evaluates the uniqueness and competitive advantage of a company's offerings within the European SaaS platforms for integrated corporate travel sourcing, booking, payment optimization, and financial reconciliation for enterprises with 500+ employees. It starts with a base score of 5 and is adjusted by specific factors:
- Adding Points: Proprietary technology (+3), Niche specialization (+2), Unique features (+2), Strategic partnerships (+2), Awards/recognition (+1).
- Subtracting Points: Commodity features (-2), "Me-too" product (-3).
Quadrant Classification
Companies are plotted into one of four quadrants based on their maturity and differentiation scores:
- Established Leaders: Maturity > 5 AND Differentiation > 5. These are robust, innovative market leaders.
- Emerging Innovators: Maturity ≤ 5 AND Differentiation > 5. These are newer or smaller companies with highly unique solutions.
- Mature Commoditized: Maturity > 5 AND Differentiation ≤ 5. These are experienced companies with standard, widely available offerings.
- Early Undifferentiated: Maturity ≤ 5 AND Differentiation ≤ 5. These are nascent companies yet to establish strong market presence or unique value.
M&A Quadrant Methodology
How Does It Work?
All postures, moves, and outcomes are scenarios — they represent what a company may do given its current signals, not what it will certainly do.
I. Core Data Points
Value Chain Stage: the company's main role in its market (e.g., Stage 1: Core Tech, Stage 4: SaaS Platform).
Dependencies: key inputs the company may need (e.g., a Stage 4 company could depend on Stages 2 and 3).
Weak Signals: recent observable data points (funding, layoffs, acquisitions) used to hypothesize the Strategic Profile.
II. Strategic Profile<
Ownership and Scale are inferred from Weak Signals — they are hypotheses, not confirmed facts.
- Seed / Pre-Seed signal suggests: Private_VC_Backed, T6_Micro
- Series A / B signal suggests: Private_VC_Backed, T5_Niche
- Series C / D signal suggests: Private_VC_Backed, T4_ScaleUp
- PE acquisition signal suggests: Private_PE_Backed, T3_Medium
- Public market signal suggests: Public_Dispersed, T1/T2/T3
- Bootstrapped signal suggests: Private_Founder_Owned, T6_Micro
Acquisition capacity is a hypothetical budget estimate, not a verified figure.
- Public / State_Owned default values: T1=50000, T2=10000.
- Private_PE_Backed: 5000 (estimated fund firepower).
- Private_VC_Backed Stock-as-Currency estimate: T4=120, T5=15, T6=2.
- Private_Founder_Owned: 1.
Acquisition posture is a hypothesis about likely motive, not confirmed intent.
- Hunter: in this scenario, the company may actively pursue acquisitions. (Predator/Aspirant)
- Opportunistic: in this scenario, the company could acquire if favorable conditions arise. (Aspirant)
- Hunted: in this scenario, the company could be a prime acquisition target. (Shopping List/Giant)
- Fortress: in this scenario, the company is likely to defend its position and may rarely acquire. (Giant)
Differentiation Score: 1-10 estimate of how unique and defensible the company's position may be.
- Score 7-10: could suggest a premium asset in an acquisition scenario.
- Score 1-3: may suggest a commoditized target in a distressed scenario.
III. SWOT (Wargame Moves)
Strengths: may include high differentiation, large scale, high acquisition capacity, or a Fortress posture.
Weaknesses: may include low differentiation, a Hunted posture, limited firepower, risky dependencies, or macro disruption exposure.
Opportunities: a Hunter may look to acquire a Hunted target or ally with a Fortress. A Hunted company may seek a Hunter acquirer or a Fortress ally. These are scenarios, not confirmed strategies.
Threats: a Predator could move to acquire the company; the company could be outbid in a Mergers and Acquisitions race; a key supplier could sign an exclusivity deal with a competitor. These are risk hypotheses, not predictions.
IV. Quadrants Definition
1. THE PREDATORS
In this scenario, these companies may possess high acquisition capacity (>=50M) and an active posture, potentially acting as hunters with overwhelming firepower.
2. THE ASPIRANTS
In this scenario, these companies may have low acquisition capacity (<50M) but an active posture, suggesting they are climbers looking to make strategic moves.
3. THE GIANTS
In this scenario, these companies may exhibit high acquisition capacity (>=50M) but a passive posture, indicating they are sleeping giants with deep pockets but low M&A motive.
4. THE POTENTIAL TARGETS
In this scenario, these companies may have low acquisition capacity (<50M) and a passive posture, potentially making them prime targets or partners for acquisition.
Company Sources
Aller plus loin sur S4BT ?Explore S4BT further?
Prenez un appel stratégique, ou suivez notre deal flow.
Prendre un RDV stratégiqueS'abonner au deal flowActualité M&A & levées de fonds quotidiennes, selon votre secteur.
Generated by Proplace.co. Proplace is an AI and may make mistakes. Contact us at alexandre@proplace.co